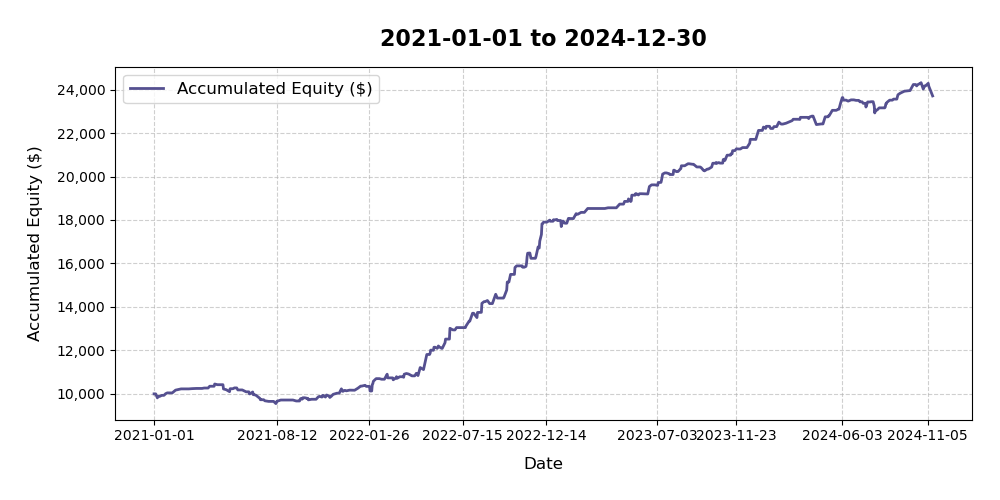
Total Out of Sample Period: 2021-01-01 - 2024-12-30
2021-01-01 - 2024-12-30
Assets with Signals: 38
Buy Orders: 168 · Sell Orders: 172
| Trades | PFb | Net PF* | Initial K | %K per trade | K Accum | Yield (%) | Max Active | Max Drawdown |
|---|---|---|---|---|---|---|---|---|
| 340 | 3.24 | 2.72 | 10,000$ | 100% (minilot) | 23,708.0 | 137.1% | 8 trades | 8.6% |
*PF: Profit Factor after deducting commissions and margins

| Year | PL$ | Opened | Accum. K | Yield (%) | Active Trades | Net Profit Factor |
|---|---|---|---|---|---|---|
| 2021 | 167.0 | 72 | 10167.0 | 1.67 | 5 | 1.1 |
| 2022 | 7836.0 | 109 | 18003.0 | 78.36 | 8 | 4.6 |
| 2023 | 3700.0 | 82 | 21703.0 | 37.00 | 5 | 3.9 |
| 2024 | 2005.0 | 77 | 23708.0 | 20.05 | 5 | 1.8 |
| Quarter | PL$ | Opened | Accum. K | Yield (%) | Active Trades | Net Profit Factor |
|---|---|---|---|---|---|---|
| 2021 | ||||||
| 2021Q1 | 250.0 | 10 | 10250.0 | 2.50 | 3 | 2.4 |
| 2021Q2 | -288.0 | 18 | 9962.0 | -2.88 | 4 | 0.6 |
| 2021Q3 | -141.0 | 18 | 9821.0 | -1.41 | 5 | 0.7 |
| 2021Q4 | 346.0 | 26 | 10167.0 | 3.46 | 4 | 1.7 |
| 2022 | ||||||
| 2022Q1 | 738.0 | 25 | 10905.0 | 7.38 | 6 | 2.1 |
| 2022Q2 | 2036.0 | 28 | 12941.0 | 20.36 | 5 | 4.7 |
| 2022Q3 | 1503.0 | 23 | 14444.0 | 15.03 | 5 | 3.9 |
| 2022Q4 | 3559.0 | 33 | 18003.0 | 35.59 | 8 | 9.5 |
| 2023 | ||||||
| 2023Q1 | 526.0 | 16 | 18529.0 | 5.26 | 4 | 2.1 |
| 2023Q2 | 1087.0 | 15 | 19616.0 | 10.87 | 4 | 6.6 |
| 2023Q3 | 643.0 | 25 | 20259.0 | 6.43 | 4 | 2.3 |
| 2023Q4 | 1444.0 | 26 | 21703.0 | 14.44 | 5 | 10.0 |
| 2024 | ||||||
| 2024Q1 | 1019.0 | 19 | 22722.0 | 10.19 | 4 | 5.0 |
| 2024Q2 | 781.0 | 22 | 23503.0 | 7.81 | 5 | 2.2 |
| 2024Q3 | 426.0 | 23 | 23929.0 | 4.26 | 5 | 1.5 |
| 2024Q4 | -221.0 | 13 | 23708.0 | -2.21 | 4 | 0.8 |